
The project has 2 foundational datasets: 2025 satellite imagery and 1977 Soviet topographic maps. Quick categorization of patterns does not seem possible.
What should be possible is to use Esri’s Image Classification tools to divide the main land use patterns that are visible on the maps:
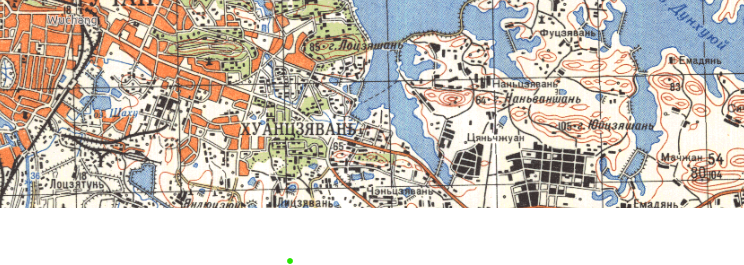
- Steep areas denoted by closely spaced orange topo lines
- Green forested areas. Often steep, so therefore there is a forested and steep class, and a forested and not steep class
- Urbanized areas symbolized with orange street blocks –with the background white of the map serving as street grid
- Smaller towns and major structures denoted by black rectilinear polygons
- Cyrillic labels. Which I would love to ignore
- And of course, blue for water.
Highways, roads, rivers, and streams round out the linear features. There are also labeled and unlabeled point symbols.
It took a lot of fiddling, but today I think the best approach is to use the segmentation tool multiple times to pick up different types of classes. I’m working on a spatially coarse run through right now, attempting to pull out cities vs steep areas. They use the same color of ink.
Below, a detail of the Wuhan sheet shows wooded and unwooded areas adjacent to urbanized Wuchang.
Leave a Reply